Description
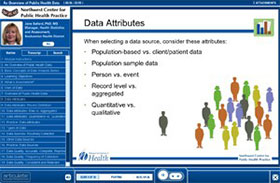
In the fourth 45-minute installment of this five-part series, Basic Concepts in Data Analysis for Community Health Assessment, you learn best practices for presenting tables and graphs of public health data.
Learning Objectives
- List the common ways to present data.
- Choose an appropriate format to present specific kinds of data.
- Identify good design practices for tables and charts.
Intended Audience
Public health professionals who want to increase their familiarity with the basic concepts of epidemiology
Basic Concepts in Data Analysis Series
Part 1: Overview of Public Health Data
Part 2: Analysis and Interpretation of Public Health Data 1
Part 3: Analysis and Interpretation of Public Health Data 2
Part 4: Presenting Public Health Data
Part 5: Data Available to Public Health Professionals
Format
These online courses have audio narration and interactive exercises. The courses take between 30 and 60 minutes.
Funding
The five courses in this series were developed by Washington State Department of Health in partnership with the Northwest Center for Public Health Practice. Funding was provided by a CDC grant for Assessment in Action, grant no. 5U82CD022378-05, to Washington State Department of Health. The contents of this training course are solely the responsibility of the authors and do not necessarily reflect the official view of CDC.
Technical Requirements
This course requires certain software and browser plugins to be installed. See our Technical Requirements page for details.
Accessibility
This online training course is audio narrated. A print version is available in the Supplemental Material section at the bottom of this page. Please note that the print version does not include interactive exercises, quizzes, or the final assessment. To receive a print version of the quizzes in this course, please contact nwcphp@uw.edu. If you have any difficulties in accessing the information given in any of our documents or need further assistance, please contact nwcphp@uw.edu.

